RyanR's web pages ('R' stands
for Rudnicki)
San Marcos, Hays county, Texas, U.S.A.
N29°53'39"; W97°56'51" (referenced to the WGS84 datum)
Elevation ~740' above MSL
(as an aside, please be aware there's
lots of weather aside from earth's.
This site
should be visited daily for solar, martian, and other solar system locales.)
We live along the southeastern edge of the Texas
Hill Country, on the lip of the eroding Balcones Escarpment. To our south
and east the land drops sharply to the Blackland Prairie region of Texas.
The elevation of downtown San Marcos, less than 1 mile to the south southeast, is ~560'.
Walk 1 1/2 blocks to our northwest and the elevation is 800'. See for
yourself
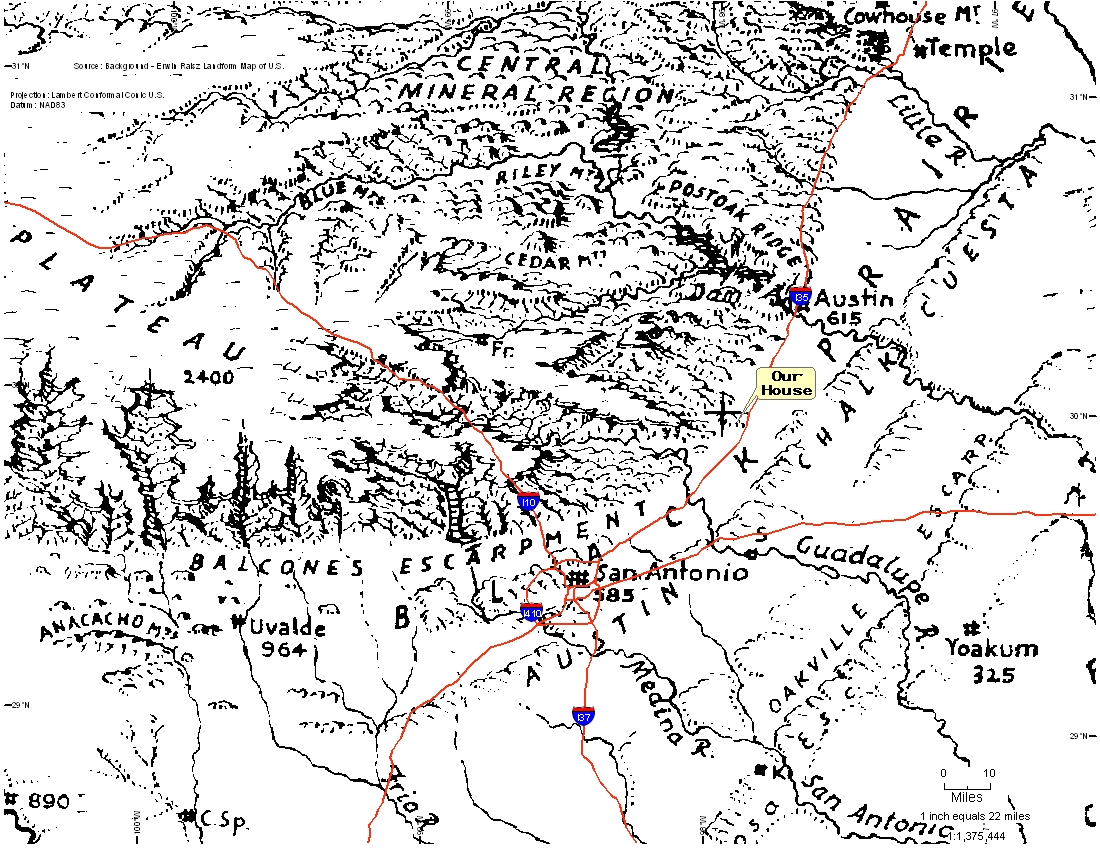 (Raisz landform map).
The result is two ecoregions, with
different trees and birds, all within a very short walking distance
 (Texas
Natural Regions map). That difference is magnified by the presence of artesian
springs at the base of the escarpment. Some 23 million gallons of water
per day gushes from the springs; enough to form the beautifully clear San Marcos
River. What an interesting place to live.
(Texas
Natural Regions map). That difference is magnified by the presence of artesian
springs at the base of the escarpment. Some 23 million gallons of water
per day gushes from the springs; enough to form the beautifully clear San Marcos
River. What an interesting place to live.
Major transportation lines (road-IH35,
rail-Union Pacific) follow the escarpment NE/SW on the flat blackland prairie.
The Balcones Escarpment even has an impact on the weather.
Here's
a description of the Escarpment's impact on a meteorological phenomenon called squall lines.
*****************************
I. Personal Mapping
This page contains links to examples of ways to make mapping personal.
The first example is the mapping of a cross-country ski trip.
The following constitute a to-do list:
The second example is mapping a volksmarch route.
The third example is mapping a geology field trip.
The fourth example is mapping a journey to work.
The fifth example is mapping a watershed.
The sixth example is remembering the path of a hurricane.
The seventh example is mapping local earthquakes.
The eighth example is mapping population distribution.
*****************************
II. Monitoring Local Atmospheric Conditions:
local
radar
Time is UTM/GMT, -6hrs for CST
AUS/SAT WXR
Discussion
cabin
radar
Time is UTM/GMT, -8hrs for PST
EKA/ACV WXR
Discussion
babcia
radar Time is UTM/GMT, -5hrs for EST
BDL WXR Discussion
In an effort to make ths synoptic current radar
maps more interactive, I'm experimenting w/ 'free' on-line mapping/mash-up tools.
So, for example, if I'd like to get a closer (or farther) view of current precipitation
(when it's happening in Hays county for now... Humboldt and Hartford counties
later), consider this courtesy of arcgis.com:
View Larger Map

*****************************
--------------------------------------
IV. Files for others:
None at present.
*****************************
Questions?... Comments?...
Send me an e-mail